
Loading verified NVDA candles...
TickerBuff
See the chart. Understand the move. Ask what happens next.
A stock charting and analysis command center that brings price action, options activity, dark-pool data, volatility, catalysts, and evidence-backed AI into one fast workspace.
Live NVDA market data powers this demoStock analysis should start with the full picture.
Most retail trading workflows are fragmented. The chart lives in one tab, options flow in another, dark-pool prints in a third, and the explanation is left to the trader. TickerBuff organizes those inputs around the ticker you are already researching.
Search a US stock and move from price action to institutional context without rebuilding your workspace. Every panel is designed to answer a specific question: what changed, what confirms the move, where price may react, and what would invalidate the setup.
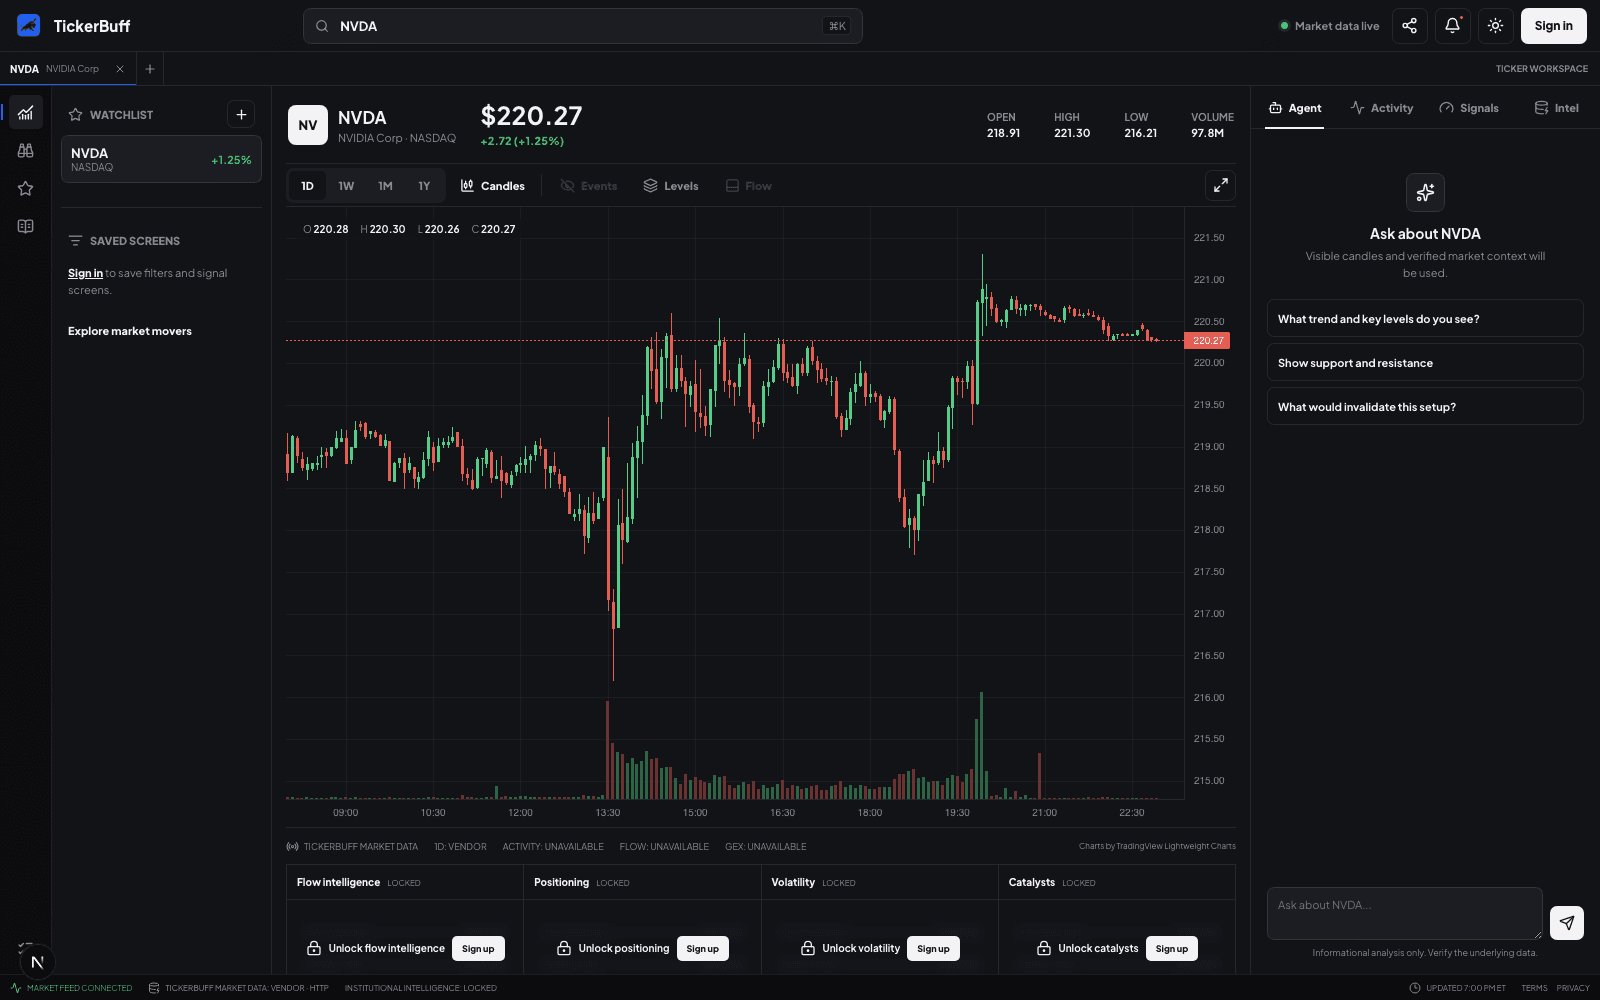
A real-time stock chart with the context already attached.
TickerBuff starts with fast candlestick charts for intraday, weekly, monthly, and yearly investigation. Instead of treating the chart as an isolated drawing surface, the workspace aligns price with volume, market structure, volatility, and the events that happened around the move.
Built-in analysis calculates pivots, VWAP, ATR, relative volume, trend structure, support, resistance, and invalidation. That gives newer traders a clear starting point while experienced traders retain the underlying evidence.
- Real-time US equity quotes and candlesticks
- 1D, 1W, 1M, and 1Y chart ranges
- Calculated trend, VWAP, ATR, pivots, and relative volume
- Support, resistance, target, and invalidation overlays
Ask the chart a question and get a traceable answer.
TickerBuff’s AI stock analysis is built for chart investigation, not generic market commentary. Ask what trend is active, where buyers or sellers have defended price, which levels matter, or what would invalidate a thesis.
The agent works from bounded evidence tools. It separates observed facts from interpretation, reports contradictions, and turns supported conclusions into chart commands you can inspect. You can see why a level was placed instead of accepting a black-box prediction.
- Plain-English analysis of visible price action
- Evidence IDs and chart-command traces
- Bullish, bearish, and neutral scenarios
- Confluence, contradiction, setup quality, and invalidation
Options flow, off-exchange activity, and positioning beside price.
Unusual options activity is more useful when it is aligned with the underlying chart. TickerBuff brings premium flow, recent option trades, gamma positioning, implied volatility, expected move, and off-exchange prints into the same ticker workspace.
The platform adds market and sector context to reduce misleading single-ticker conclusions. Ownership timelines can connect institutional holdings, insider activity, congressional disclosures, and ETF exposure without forcing you to compare raw tables manually.
- Call and put premium flow by expiration
- Gamma exposure, dealer levels, and expected move
- Dark-pool and off-exchange retest levels
- Institutional, insider, Congress, and ETF ownership context
Find the setup, save the screen, and monitor what changes.
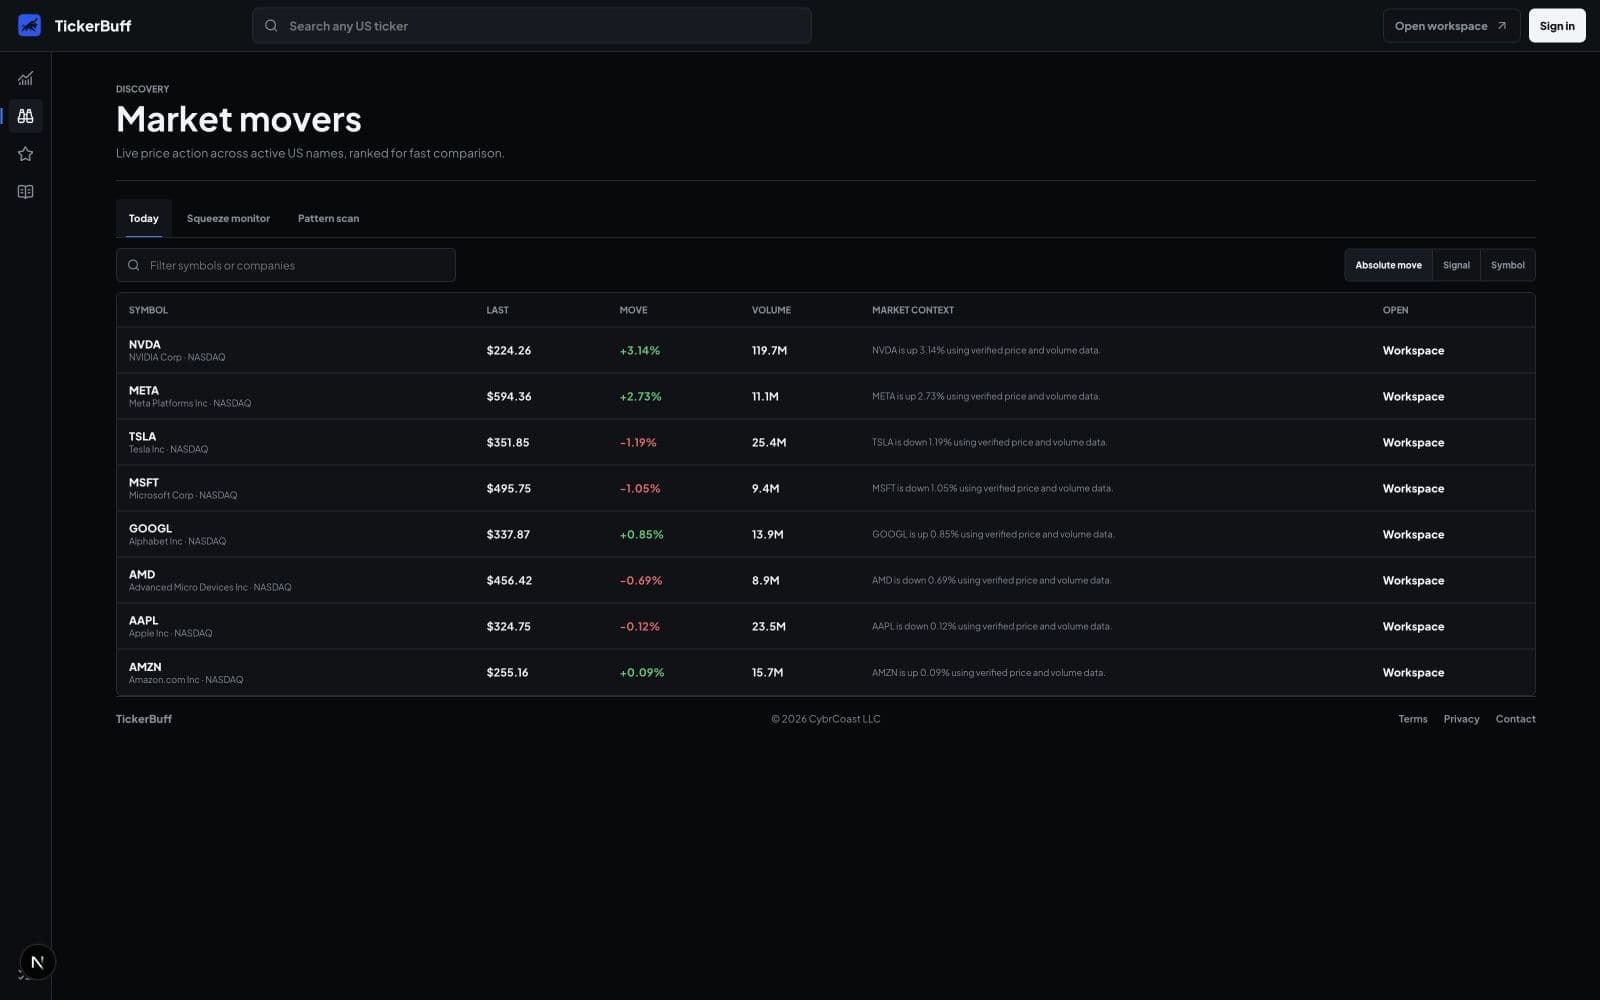
TickerBuff is designed to become a repeatable trading research workflow. Market discovery highlights movers, squeeze candidates, developing chart patterns, volatility dislocations, and persistent institutional flow rather than presenting an unexplained scanner result.
Watchlists, saved layouts, filters, overlays, and analyses follow your account. As the signal system expands, users will be able to combine their own conditions and filters with TickerBuff’s evidence model and evaluate how those signals performed historically.
- Market movers, squeeze, and pattern discovery
- Saved watchlists, layouts, filters, and overlays
- Persistent-flow and key-level alert foundations
- Historical signal-outcome tracking
From ticker search to an evidence-backed setup.
TickerBuff keeps the common stock-research sequence inside one command center so context survives as you move between the chart, institutional activity, and AI analysis.
- 01Search a ticker
Open any supported US equity from the command bar or your saved watchlist.
- 02Read price structure
Review candles, trend, volume, levels, volatility, and the latest catalyst context.
- 03Check confirmation
Compare the move with options flow, positioning, off-exchange activity, and broader market alignment.
- 04Ask and act
Request scenarios, place traceable levels on the chart, and save the setup for continued monitoring.
What traders ask before opening the workspace.
What is TickerBuff?+
TickerBuff is a real-time stock charting and market-intelligence workspace. It combines price action, unusual options activity, off-exchange trading, volatility, ownership context, and AI-assisted chart analysis around a single ticker.
Is TickerBuff a replacement for TradingView?+
TickerBuff covers the core chart-investigation workflow but focuses more heavily on explanation and institutional context. It is designed for traders who want to understand a setup without manually assembling indicators, options flow, dark-pool activity, and catalysts across separate services.
How does the AI stock analysis work?+
The agent is grounded in the candles, calculated levels, market structure, and authorized intelligence visible in the workspace. It separates observed facts from interpretation and can place traceable support, resistance, target, and invalidation commands on the chart.
Does TickerBuff provide real-time market data?+
TickerBuff supports real-time US equity quotes and candles through its streaming market-data infrastructure. Dataset freshness and availability can vary by market session, entitlement, symbol, and upstream venue.
Is TickerBuff investment advice?+
No. TickerBuff is an informational research product. Its charts, signals, scenarios, and AI explanations are context for your own analysis and are not personalized investment advice or a guarantee of future performance.
Put the whole ticker story on one screen.
Open the live workspace, search a symbol, and start with the chart instead of a setup wizard.